offering
Hypothetical Growth of $100,000
The chart reflects a hypothetical investment and assumes reinvestment of dividends and capital gains. Fund expenses, including management fees and other expenses were deducted.
Past performance is not indicative of future results. An investment in FS Credit REIT is not a direct investment in real estate and has material differences from a direct investment in real estate, including those related to fees and expenses, liquidity and tax treatment.
FS Credit REIT is not traded on an exchange. The beginning value of Class I is the NAV per share as of the share class’s inception date on January 5, 2018. The beginning value of Class S is the NAV per share as of the share class’s inception date on May 4, 2018. The ending value is the transaction price as of January 1, 2026 (which generally equals the prior month’s NAV). The illustration assumes reinvestment of distributions pursuant to FS Credit REIT’s share repurchase program. Indexes are shown for illustrative purposes only. Each asset class is suitable for specific investor objectives, which vary greatly.
income
ANNUALIZED DISTRIBUTION RATE FOR CLASS i1
ANNUALIZED DISTRIBUTION RATE FOR CLASS S1
preservation
Months with positive total return (Class I)2
Largest monthly drawdown (Class I)3
Largest monthly drawdown (Class s)3
diversification
modified duration (Years)4
Invested in Private
Real Estate Debt
As with any investment, investors should make sure they consider the key risks before investing. In the case of commercial mortgages, loans are subject to illiquidity risk and default risk. There is also no assurance that commercial real estate investments will provide regular, stable distributions.
- The annualized distribution rate shown is expressed as a percentage equal to the projected annualized distribution amount per share (which is calculated by annualizing the most recent monthly cash distribution per share as of the date indicated, without compounding), divided by the net asset value per share. For the 12 months ended December 31, 2024, 100% of FS Credit REIT’s distributions were funded through net income.
- 93 months with positive total returns since inception out of 95 months (based on Class I).
- Largest monthly drawdown for Class I and Class S occurred March 2020.
- Duration is a measure of how sensitive a fixed income investment’s price is to a change in interest rates and is expressed as a number of years.
why commercial real estate debt investing
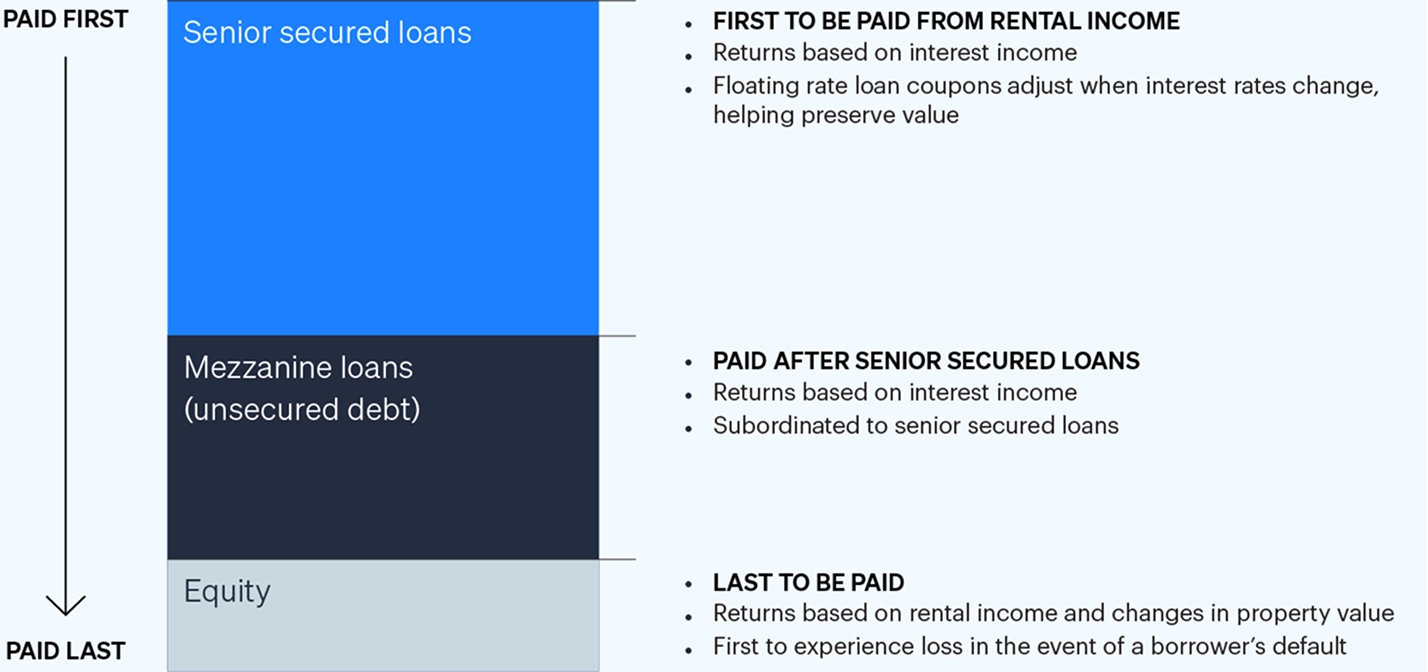
* U.S. Federal Reserve, as of September 30, 2024. Commercial mortgage loans are illiquid and may not have a secondary market. Consider the key risks before investing. While commercial loans are secured by a first-priority mortgage, they are subject to the risk of default. Although senior loans may be prioritized in payment, as represented in the image, there is no assurance that the valuation of the property that is collateral will be correct, thus, there is risk in investing in senior secured loans.
what it means to be a senior lender
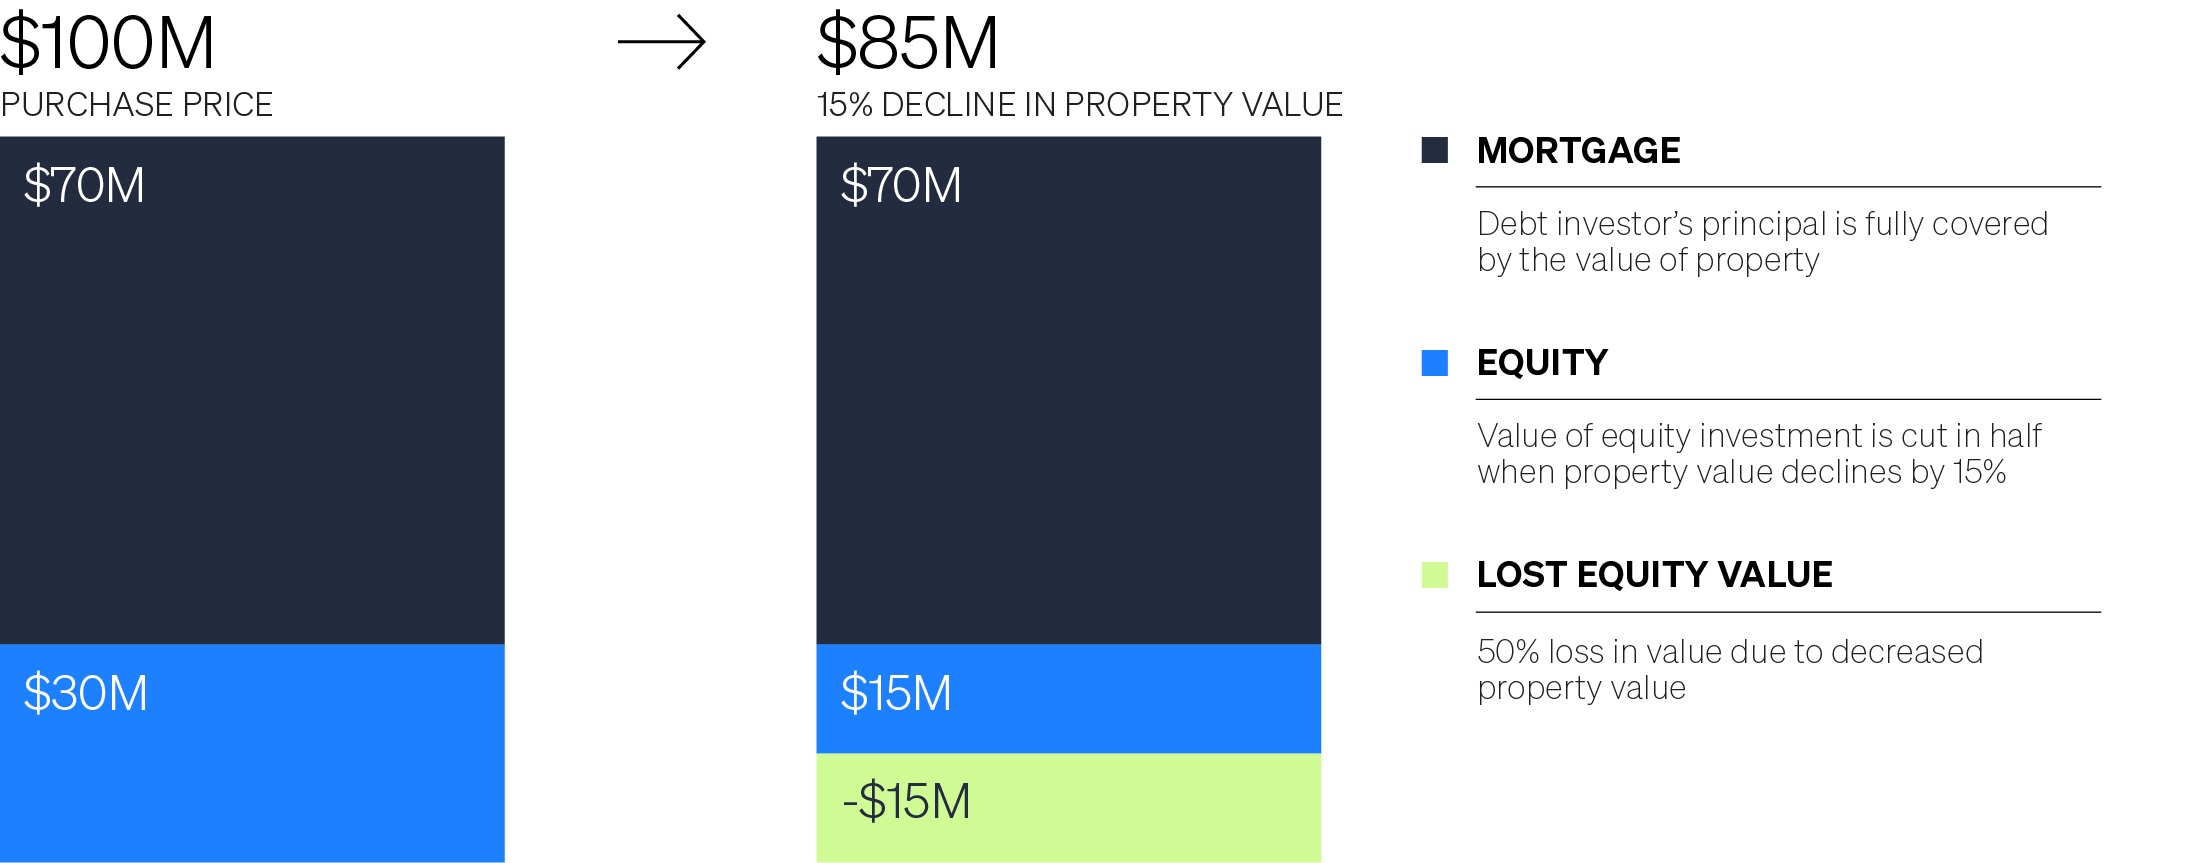
what happens if property values decline?
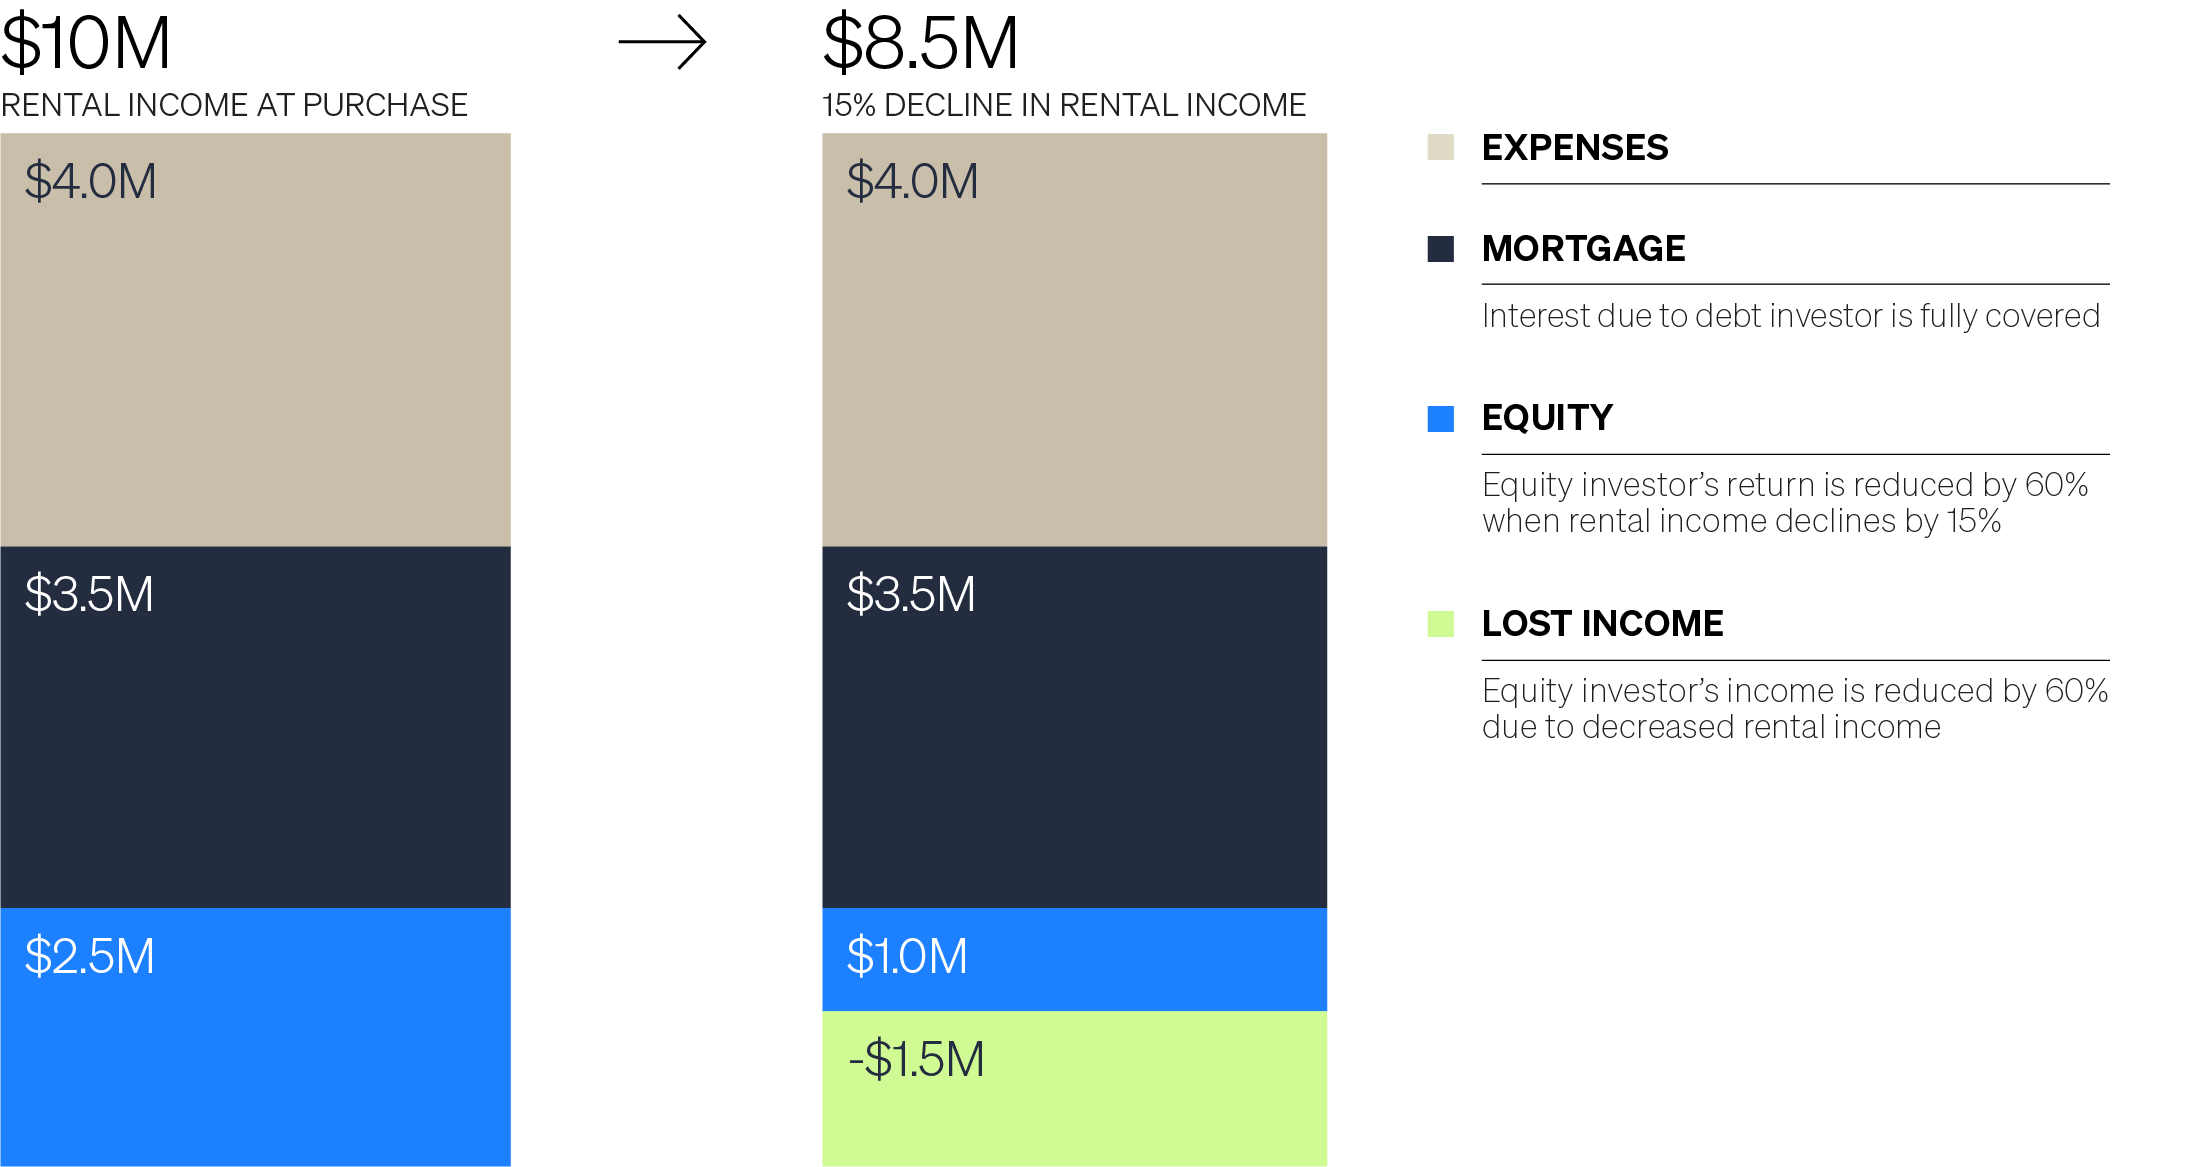
what happens if rental income fails?
Tax advantaged distributions
Annualized distribution rate comparison

Assumes a 37% tax bracket as of September 30, 2025
FS Credit REIT’s failure to qualify or remain qualified to be taxed as a REIT would adversely affect the NAV and the amount of cash available for distribution to stockholders.
- Dividends that are not declared as capital gain dividends or qualified dividend income.
- Tax-equivalent distribution rate reflects the distribution rate required under the prior tax law in order for an investor to receive the same after-tax income under the new tax law. For example, a REIT’s annualized distribution rate would need to be 8.6% under the prior tax law in order for investors to receive the same amount of after-tax income as a REIT with an annualized distribution rate of 7.7% under the new tax law.
FS Credit REIT seeks to deliver an alternative source of income by investing in private commercial real estate debt.
A diversified portfolio of commercial real estate debt
Investment type
Property Types5
Top 5 states
Portfolio
Characteristics1,2,3,4
Geography5
All portfolio data as of 11/30/2025. Unless otherwise stated.
- 93 months with positive total returns since inception out of 95 months (based on Class I).
- Duration is a measure of how sensitive a fixed income investment’s price is to a change in interest rates and is expressed as a number of years.
- Largest monthly drawdown for Class I and Class S occurred March 2020.
- Total assets are comprised of the sum of loans receivable, investment in real estate, mortgage-backed securities held-to-maturity, mortgage-backed securities (at fair value), cash and cash equivalents, restricted cash, receivables for investments sold, repaid interest receivables and other assets.
- Represents holdings with multiple property types.
- Represents holdings across multiple geographic regions.